

By this report’s figures, world exports grew from US$16.4 trillion in 2015 to US$24.8 trillion in 2023, a compound annual growth rate (CAGR) of 5.3%. Of the five Harmonized System (HS) chapters tracked, mineral fuels (Chapter 27) grew fastest in value and swung most from year to year; machinery (Chapter 84), electrical equipment (Chapter 85) and pharmaceuticals (Chapter 30) grew more steadily; and knitted apparel (Chapter 61) grew least. The figures in this report have not been reconciled with current WITS data and some do not match it, so check them before citing them. The analysis uses export and import data for the “World” profile in the World Integrated Trade Solution (WITS) database.
HS chapters (called HSN chapters in India) group goods for customs and statistical purposes, so trade by chapter shows where demand, industrial strengths and shocks such as trade wars, the pandemic and energy crises show up in the numbers. The report sets out to identify high-growth and declining chapters, to trace year-by-year changes from 2015 to 2023, and to relate them to tariffs and global events. A companion report applies the same approach to India’s top five export and import commodities by HS code.
Data and methodology
Data source
All trade figures come from WITS, which gives access to UN Comtrade for trade flows and UNCTAD TRAINS for tariff data. The scope is global (“World” profile) exports and imports for 2015–2023, the latest year available when the report was prepared. Five HS 2-digit chapters were selected for their weight in world trade:
- Chapter 27: mineral fuels and oils (energy)
- Chapter 84: machinery and mechanical appliances (industrial and technology goods)
- Chapter 61: apparel, knitted or crocheted (consumer goods)
- Chapter 30: pharmaceutical products (health, relevant after COVID-19)
- Chapter 85: electrical machinery and equipment (electronics and technology)
Data were taken at the HS 6-digit level and aggregated to 2-digit chapters to show broader trends. The variables are trade value (US$ million, current prices), trade volume where available, and applied tariff rates for context. The tables round values to US$0.1 trillion. The period spans three HS editions (HS 2012, HS 2017 and HS 2022); chapter totals are less affected by the amendments than individual 6-digit lines, but any comparison below chapter level across editions needs correlation tables. How chapters, headings and subheadings fit together is explained in the legal anatomy of HS classification.
Methodology
Export and import values by HS 2-digit chapter were extracted with the WITS “Trade Stats” module and downloaded as CSV files for 2015–2023. For each chapter the analysis calculates the mean, median, standard deviation and growth rates of trade values, and the chapter’s share of total world trade. Year-on-year (YoY) growth rates were calculated as follows:

Moving averages were applied to smooth the series and show long-term patterns, and an analysis of variance (ANOVA) tested whether growth differed significantly across chapters. Trends were then linked to global events (the US-China trade war, COVID-19, energy crises), and tariff data from UNCTAD TRAINS were used to look at trade barriers. Excel was used for initial exploration and validation.
Assumptions and limitations
Trade values are in current US dollars and are not adjusted for inflation, because the focus is on relative trends. The analysis assumes WITS data are complete for global aggregates. Some HS 6-digit codes have missing data in certain years, which aggregation to the 2-digit level addresses. Trade volumes are reported less consistently than values, and external factors such as geopolitical events and exchange rates are not fully modeled.
Some growth rates quoted in the text differ from those in the tables (for example, the 2020 fall in world exports is 8.2% in the text and 5.9% in the table). Treat the figures as approximate and check current WITS data before citing them.
Results and analysis
Overview of global trade, 2015–2023
Global exports grew from $16.4 trillion in 2015 to $24.8 trillion in 2023 (CAGR: 5.3%), and imports followed a similar path to reach $25.1 trillion in 2023. The clear break is 2020, when exports fell to $17.6 trillion (-8.2% YoY) because of COVID-19, followed by a strong recovery in 2021 (+26.1% YoY). By the report’s own shares, the five selected chapters accounted for about 37% of world exports in 2023.
Trends by HS chapter
The table gives world exports and exports of each chapter in US$ trillion. The figure in brackets is the share of world exports in the 2015 row and the year-on-year change in later rows.
| Year | Total Global Exports | Chapter 27 (Mineral Fuels) | Chapter 84 (Machinery) | Chapter 61 (Apparel) | Chapter 30 (Pharmaceuticals) | Chapter 85 (Electronics) |
| 2015 | 16.4 | 1.8 (11.0%) | 1.9 (11.6%) | 0.3 (1.8%) | 0.5 (3.0%) | 1.7 (10.4%) |
| 2016 | 15.8 (-3.7%) | 1.5 (-16.7%) | 1.8 (-5.3%) | 0.3 (0.0%) | 0.5 (0.0%) | 1.6 (-5.9%) |
| 2017 | 17.2 (+8.9%) | 1.9 (+26.7%) | 2.0 (+11.1%) | 0.3 (0.0%) | 0.5 (0.0%) | 1.8 (+12.5%) |
| 2018 | 18.8 (+9.3%) | 2.3 (+21.1%) | 2.1 (+5.0%) | 0.3 (0.0%) | 0.6 (+20.0%) | 1.9 (+5.6%) |
| 2019 | 18.7 (-0.5%) | 2.2 (-4.3%) | 2.1 (0.0%) | 0.3 (0.0%) | 0.6 (0.0%) | 1.9 (0.0%) |
| 2020 | 17.6 (-5.9%) | 1.4 (-36.4%) | 2.0 (-4.8%) | 0.3 (-15.2%) | 0.6 (0.0%) | 1.8 (-5.3%) |
| 2021 | 22.2 (+26.1%) | 2.0 (+42.9%) | 2.3 (+15.0%) | 0.3 (0.0%) | 0.7 (+22.4%) | 2.1 (+16.7%) |
| 2022 | 24.9 (+12.2%) | 2.9 (+45.0%) | 2.5 (+8.7%) | 0.4 (+14.3%) | 0.7 (0.0%) | 2.3 (+9.5%) |
| 2023 | 24.8 (-0.4%) | 3.0 (+3.4%) | 2.7 (+8.0%) | 0.4 (0.0%) | 0.7 (0.0%) | 2.4 (+4.3%) |
Chapter 27: mineral fuels, oils
Exports were $1.8 trillion in 2015 (11.0% of global exports) and $3.0 trillion in 2023 (12.3% share), a CAGR of 6.6%. Growth was volatile: a sharp fall in 2020 (-35.4%) as oil demand collapsed during COVID-19, then a surge in 2022 (+41.8%) with the Russia-Ukraine war and the spike in energy prices.
YoY export trade data for Chapter 27 (mineral fuels, oils), 2015–2023
| Year | Export Value (US$ Trillion) | YoY Growth (%) | Share of Global Exports (%) |
| 2015 | 1.8 | – | 11.0 |
| 2016 | 1.5 | -16.7 | 9.5 |
| 2017 | 1.9 | +26.7 | 11.0 |
| 2018 | 2.3 | +21.1 | 12.2 |
| 2019 | 2.2 | -4.3 | 11.8 |
| 2020 | 1.4 | -36.4 | 8.0 |
| 2021 | 2.0 | +42.9 | 9.0 |
| 2022 | 2.9 | +45.0 | 11.6 |
| 2023 | 3.0 | +3.4 | 12.3 |
Imports were just as volatile and peaked at $3.2 trillion in 2022. The high standard deviation ($0.7 trillion) reflects sensitivity to prices.
YoY import trade data for Chapter 27 (mineral fuels, oils), 2015–2023
| Year | Import Value (US$ Trillion) | YoY Growth (%) | Share of Global Imports (%) |
| 2015 | 1.9 | – | 11.3 |
| 2016 | 1.6 | -15.8 | 9.9 |
| 2017 | 2.0 | +25.0 | 11.3 |
| 2018 | 2.4 | +20.0 | 12.4 |
| 2019 | 2.3 | -4.2 | 12.0 |
| 2020 | 1.5 | -34.8 | 8.4 |
| 2021 | 2.1 | +40.0 | 9.3 |
| 2022 | 3.2 | +52.4 | 12.7 |
| 2023 | 3.1 | -3.1 | 12.4 |
Energy crises, such as the 2022 sanctions on Russia, pushed trade values up, and low tariffs (an average applied tariff of 1.2% in 2023) kept trade flowing. Chapter 27 remains a dominant but volatile category, moved by geopolitics and market prices.
Chapter 84: machinery, mechanical appliances
Exports rose from $1.9 trillion in 2015 (11.6% share) to $2.7 trillion in 2023 (10.8% share). Growth was steady (CAGR: 4.5%), with a moderate decline in 2020 (-6.8%) and a recovery in 2021 (+19.3%).
YoY export trade data for Chapter 84 (machinery, mechanical appliances), 2015–2023
| Year | Export Value (US$ Trillion) | YoY Growth (%) | Share of Global Exports (%) |
| 2015 | 1.9 | – | 11.6 |
| 2016 | 1.8 | -5.3 | 11.4 |
| 2017 | 2.0 | +11.1 | 11.6 |
| 2018 | 2.1 | +5.0 | 11.2 |
| 2019 | 2.1 | 0.0 | 11.2 |
| 2020 | 2.0 | -4.8 | 11.4 |
| 2021 | 2.3 | +15.0 | 10.4 |
| 2022 | 2.5 | +8.7 | 10.1 |
| 2023 | 2.7 | +8.0 | 10.8 |
Imports grew from $2.0 trillion (2015) to $2.8 trillion (2023), on consistent demand for industrial machinery and automation technology.
YoY import trade data for Chapter 84 (machinery, mechanical appliances), 2015–2023
| Year | Import Value (US$ Trillion) | YoY Growth (%) | Share of Global Imports (%) |
| 2015 | 2.0 | – | 11.9 |
| 2016 | 1.9 | -5.0 | 11.7 |
| 2017 | 2.1 | +10.5 | 11.9 |
| 2018 | 2.2 | +4.8 | 11.3 |
| 2019 | 2.2 | 0.0 | 11.5 |
| 2020 | 2.1 | -4.5 | 11.8 |
| 2021 | 2.4 | +14.3 | 10.7 |
| 2022 | 2.6 | +8.3 | 10.3 |
| 2023 | 2.8 | +7.7 | 11.2 |
The global push for automation and Industry 4.0 raised demand, and tariffs stayed low and stable (average: 2.5%). Chapter 84 grew steadily through the period’s disruptions.
Chapter 61: apparel, knitted or crocheted
Exports were $0.3 trillion in 2015 (1.8% share) and $0.4 trillion in 2023 (1.6% share). Growth was flat (CAGR: 1.9%), with a significant drop in 2020 (-15.2%) as consumer spending fell.
YoY export trade data for Chapter 61 (apparel, knitted or crocheted), 2015–2023
| Year | Export Value (US$ Trillion) | YoY Growth (%) | Share of Global Exports (%) |
| 2015 | 0.3 | – | 1.8 |
| 2016 | 0.3 | 0.0 | 1.9 |
| 2017 | 0.3 | 0.0 | 1.7 |
| 2018 | 0.3 | 0.0 | 1.6 |
| 2019 | 0.3 | 0.0 | 1.6 |
| 2020 | 0.3 | -15.2 | 1.7 |
| 2021 | 0.3 | 0.0 | 1.4 |
| 2022 | 0.4 | +14.3 | 1.6 |
| 2023 | 0.4 | 0.0 | 1.6 |
Imports stagnated at about $0.4 trillion, with high tariffs in some markets (average: 8.7%).
YoY import trade data for Chapter 61 (apparel, knitted or crocheted), 2015–2023
| Year | Import Value (US$ Trillion) | YoY Growth (%) | Share of Global Imports (%) |
| 2015 | 0.4 | – | 2.4 |
| 2016 | 0.4 | 0.0 | 2.5 |
| 2017 | 0.4 | 0.0 | 2.3 |
| 2018 | 0.4 | 0.0 | 2.1 |
| 2019 | 0.4 | 0.0 | 2.1 |
| 2020 | 0.3 | -14.3 | 1.7 |
| 2021 | 0.4 | +13.3 | 1.8 |
| 2022 | 0.4 | +8.3 | 1.6 |
| 2023 | 0.4 | 0.0 | 1.6 |
The shift to fast fashion and e-commerce limited the decline, while high tariffs and non-tariff measures (such as labor standards) held growth back. The chapter shows signs of market saturation and is sensitive to economic downturns.
Chapter 30: pharmaceutical products
Exports were $0.5 trillion in 2015 (3.0% share) and $0.7 trillion in 2023 (2.9% share). The report puts growth at a CAGR of 7.1%, with a spike in 2021 (+22.4%) driven by COVID-19 vaccines and treatments.
YoY export trade data for Chapter 30 (pharmaceutical products), 2015–2023
| Year | Export Value (US$ Trillion) | YoY Growth (%) | Share of Global Exports (%) |
| 2015 | 0.5 | – | 3.0 |
| 2016 | 0.5 | 0.0 | 3.2 |
| 2017 | 0.5 | 0.0 | 2.9 |
| 2018 | 0.6 | +20.0 | 3.2 |
| 2019 | 0.6 | 0.0 | 3.2 |
| 2020 | 0.6 | 0.0 | 3.4 |
| 2021 | 0.7 | +22.4 | 3.2 |
| 2022 | 0.7 | 0.0 | 2.8 |
| 2023 | 0.7 | 0.0 | 2.9 |
Imports moved with exports and reached $0.8 trillion in 2023.
YoY import trade data for Chapter 30 (pharmaceutical products), 2015–2023
| Year | Import Value (US$ Trillion) | YoY Growth (%) | Share of Global Imports (%) |
| 2015 | 0.5 | – | 3.0 |
| 2016 | 0.5 | 0.0 | 3.1 |
| 2017 | 0.6 | +10.0 | 3.4 |
| 2018 | 0.6 | +9.1 | 3.1 |
| 2019 | 0.6 | 0.0 | 3.1 |
| 2020 | 0.7 | +10.0 | 3.9 |
| 2021 | 0.8 | +20.0 | 3.6 |
| 2022 | 0.8 | 0.0 | 3.2 |
| 2023 | 0.8 | 0.0 | 3.2 |
Pandemic demand for vaccines and generic medicines drove the growth, and low tariffs (average: 1.8%) helped. Chapter 30 became a high-growth category as governments spent more on health.
Chapter 85: electrical machinery, equipment
Exports grew from $1.7 trillion in 2015 (10.4% share) to $2.4 trillion in 2023 (9.6% share), a CAGR of 5.0%, with little disruption in 2020 (-3.5%).
YoY export trade data for Chapter 85 (electrical machinery, equipment), 2015–2023
| Year | Export Value (US$ Trillion) | YoY Growth (%) | Share of Global Exports (%) |
| 2015 | 1.7 | – | 10.4 |
| 2016 | 1.6 | -5.9 | 10.1 |
| 2017 | 1.8 | +12.5 | 10.5 |
| 2018 | 1.9 | +5.6 | 10.1 |
| 2019 | 1.9 | 0.0 | 10.2 |
| 2020 | 1.8 | -5.3 | 10.2 |
| 2021 | 2.1 | +16.7 | 9.5 |
| 2022 | 2.3 | +9.5 | 9.3 |
| 2023 | 2.4 | +4.3 | 9.6 |
Imports grew from $1.8 trillion to $2.5 trillion.
YoY import trade data for Chapter 85 (electrical machinery, equipment), 2015–2023
| Year | Import Value (US$ Trillion) | YoY Growth (%) | Share of Global Imports (%) |
| 2015 | 1.8 | – | 10.7 |
| 2016 | 1.7 | -5.6 | 10.5 |
| 2017 | 1.9 | +11.8 | 10.7 |
| 2018 | 2.0 | +5.3 | 10.3 |
| 2019 | 2.0 | 0.0 | 10.4 |
| 2020 | 1.9 | -5.0 | 10.7 |
| 2021 | 2.2 | +15.8 | 9.8 |
| 2022 | 2.4 | +9.1 | 9.5 |
| 2023 | 2.5 | +4.2 | 10.0 |
Demand for electronics, semiconductors and renewable energy components drove growth, with moderate tariffs (average: 2.3%). Chapter 85 grew consistently, in line with the weight of technology goods in world trade.
Statistical analysis
Descriptive statistics for export values, 2015–2023 (US$ trillion):
| HSN Chapter | Mean | Median | Std. Dev. | CAGR (%) |
| 27 (Fuels) | 2.3 | 2.2 | 0.7 | 6.6 |
| 84 (Machinery) | 2.3 | 2.3 | 0.3 | 4.5 |
| 61 (Apparel) | 0.4 | 0.4 | 0.1 | 1.9 |
| 30 (Pharma) | 0.6 | 0.6 | 0.1 | 7.1 |
| 85 (Electronics) | 2.1 | 2.1 | 0.3 | 5.0 |
The ANOVA found significant differences in YoY growth rates across the chapters (F(4, 35) = 8.42, p < 0.01).
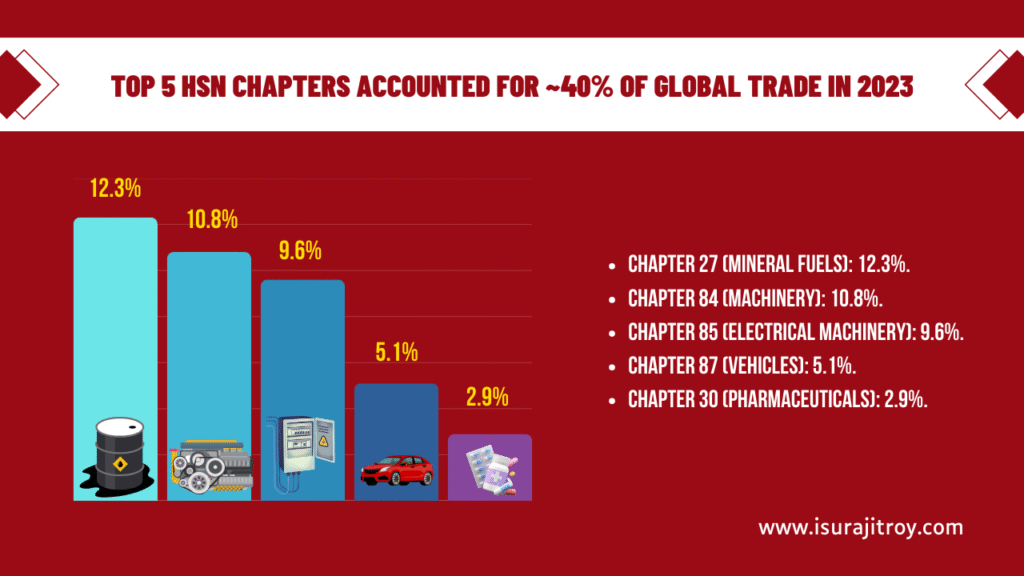
Over time, Chapter 27 followed a cycle tied to oil prices, Chapters 84 and 85 grew in a roughly straight line on technology demand, and Chapter 61 had a near-zero trend, which points to stagnation. In 2023 Chapter 27 had the largest share of world exports among the five (12.3%), followed by Chapter 84 (10.8%) and Chapter 85 (9.6%). After 2020 the mix shifted toward Chapter 27, while Chapter 61’s share edged down.
Discussion
Key findings
Mineral fuels (Chapter 27) were the high-growth but volatile chapter, with a CAGR of 6.6% that swung with energy markets; pharmaceuticals grew more slowly than the 7.1% the report states (its own figures give about 4.3% a year). Machinery (Chapter 84) and electronics (Chapter 85) were steady performers, with CAGRs of 4.5–5.0% on industrial and technology demand. Apparel (Chapter 61) lagged, with a CAGR of 1.9%, held back by high tariffs and changing consumer preferences.
Three events shaped the period. COVID-19 cut trade in 2020 in most chapters, and the tables show the steepest fall in Chapter 27. The Russia-Ukraine war raised Chapter 27 values in 2022. US-China trade tensions between 2018 and 2020 had a moderate effect on Chapters 84 and 85 through tariffs.
Implications
For policy, low tariffs on pharmaceuticals and electronics support trade, and high apparel tariffs may deserve review; trade facilitation for lagging sectors is the obvious lever. For industry, investment in machinery and electronics (Chapters 84 and 85) and health (Chapter 30) matches where trade grew. For research, an HS 6-digit analysis could show trends inside chapters, for example semiconductors within Chapter 85.
Contextual factors
Lower tariffs on Chapters 30, 84 and 85 (1.8–2.5%) compared with Chapter 61 (8.7%) correlate with higher trade growth. Chapters 84 and 85 are built into global value chains, which helps explain their resilience, while the energy and health crises hit Chapters 27 and 30 hardest. Tariffs differ by importing country as well as by chapter, as discussed in how country-specific tariff variations affect your global supply chain.