
Disclaimer: The information contained in this document is for educational and informational purposes only and should not be construed as investment advice. I am not registered with the Securities and Exchange Board of India (SEBI) as a financial advisor. This is not a recommendation to buy or sell any security. Before investing in any security, you should consult with a qualified financial advisor to determine if the investment is suitable for your investment objectives and risk tolerance. Investing in the stock market is subject to market risks.
Short selling is a powerful day trading technique that allows traders to profit from falling prices. Unlike buying (going long), short selling involves selling a stock you don’t own, expecting to buy it back at a lower price. This article breaks down the mathematics, strategies, and chart analysis behind short selling for intraday profits.


What is Short Selling?
Short selling involves:
- Borrowing shares from a broker.
- Selling them at the current market price.
- Repurchasing them (buying to cover) at a lower price.
- Returning the borrowed shares.
Profit Calculation:
Profit=(Sell Price−Buy Price)×Number of Shares−Fees
📌 Example:
- Sell at $100
- Buy back at $95
- Shares: 100
Profit=(100−95)×100=$500
Key Risks
Unlimited Loss: If the stock rises instead of falling, losses can be infinite.
Short Squeeze: Rapid upward price movement due to heavy short covering.
Borrow Availability: Not all stocks are available to short.
Chart Patterns for Short Selling
1. Bear Flag Pattern
- Downtrend → brief consolidation → continuation of the fall.
- Ideal for entering short at the breakout below consolidation.
🔎 Chart Signals:
- Tight price channel upward during consolidation.
- Breakout on increasing volume.
2. Breakdown Below Support
- A strong support level breaks with volume.
- Entry below the breakdown line.
🔢 Risk/Reward Ratio Example:
- Entry: $50
- Stop loss: $52
- Target: $46
Risk=52−50=2Reward=50−46=4⇒R/R Ratio=1:2
3. Gap and Fade
- Stock gaps up due to news → fades throughout the day.
- Traders short the fade when momentum stalls.
✅ Ideal Setup:
- Low float stock.
- Overbought RSI (>70).
- Bearish divergence.
Indicators & Tools
| Indicator | Use Case in Shorting |
|---|---|
| RSI | Overbought = short signal |
| VWAP | Short below VWAP |
| MACD | Bearish crossover confirmation |
| Volume Profile | High-volume breakdown zones |
Position Sizing Formula
Position Size= (Account Risk %×Account Size)/Stop Loss Per Share
📌 Example:
- Risk: 1% of $10,000 = $100
- Stop loss: $2/share
Position Size= (100/2) = 50 shares
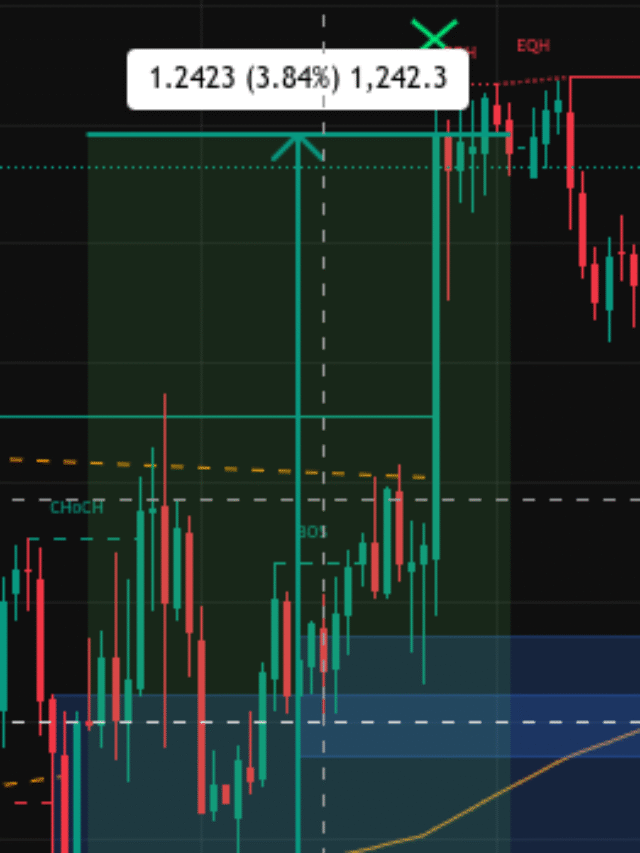
Real-World Chart Breakdown
Let’s take an example (e.g., AAPL) with a support breakdown:
- Entry: Below $165 support
- Stop Loss: Above $166.5
- Exit: $160
- Entry Trigger: Increased volume + RSI crossing below 50
💡 Tip: Look for volume confirmation. If volume increases on the breakdown, the move is likely strong.
Short Selling Strategy Checklist
- Identify bearish pattern (flag, double top, etc.)
- Check volume, RSI, and VWAP positioning
- Set clear stop-loss and take-profit levels
- Calculate position size using risk management
- Monitor for short squeeze signals
Conclusion
Short selling is not just betting against a stock—it’s a strategic, calculated approach to profit in declining markets. Mastering chart patterns, volume analysis, and risk management is crucial. With discipline, short selling can be a core weapon in a day trader’s arsenal.