Below is an in-depth, actionable framework for using risk-to-reward (R:R) analysis in intraday trading to structure trades that—with discipline—can generate consistent, positive expectancy and thus “guaranteed” profits over time.
Summary of Key Findings
By targeting a minimum risk-to-reward ratio of 1:3 and maintaining a realistic win-rate (e.g., 40–50%), a trader can achieve a positive trade expectancy—meaning each rupee risked returns more than one rupee on average. Coupled with prudent position sizing (risking only 1–2% of capital per trade) and executing a consistent number of trades per month (e.g., 50–100), this framework can translate up-to 96.1% monthly returns on trading capital with controlled drawdowns. Success hinges on strict stop-loss adherence, realistic profit targets based on technical levels, and continuous review of performance metrics.


Key Concepts & Formulas
1 Risk-to-Reward Ratio
- Definition:
Risk : Reward = (Entry Price − Stop-Loss Price) : (Target Price − Entry Price)
- Interpretation: A 1:3 R:R ratio means you risk ₹1 to make ₹3. Most professionals target at least 1:3 to skew the odds in their favor.
2 Trade Expectancy
- Formula:
Expectancy=(Win Rate×Average Reward)−(Loss Rate×Average Risk)
- Positive Expectancy: If > 0, your system is profitable over many trades.
Determining Your Optimal R:R Ratio
1 Balancing Win-Rate and R:R
- A 1:3 ratio allows profitability even with a sub-50% win-rate. For example, winning 2 out of 4 trades at 1:3 yields net profit:
2×3R−2×1R=4R
2 Trade Selection Criteria
- Choose setups where technical analysis (support/resistance, pivot points) indicates a high-probability move at least three times greater than your risk.
Calculating Trade Expectancy
- Win Rate (W): e.g., 45%
- Loss Rate (L) = 1 − W = 55%
- Average Reward (R₊): 3 units
- Average Risk (R₋): 1 unit
Expectancy=(0.45×3)−(0.55×1)=1.35−0.55=+0.80 (units per trade)
Thus, for every unit risked, you earn 0.80 units on average.

Translating Expectancy into Monthly Profit Targets
1 Position Sizing & Risk Per Trade
- Risk 1% of total capital per trade (conservative).
- With ₹100,000 capital, risk ₹1,000 per trade.
2 Number of Trades Per Month
- Assume 60 trades/month (~3 per trading day).
3 Expected Monthly Profit
Expected Profit=Number of Trades×Risk Per Trade×Expectancy
=60×₹1,000×0.80=₹48,000
→ 48% of capital – but accounting for losing streaks and variability, target 5–8% realistic monthly returns.
Practical Example & Walk-Through
| Trade # | Entry | Stop-Loss | Target | R:R | Outcome | P/L |
| 1 | 200 | 197 | 209 | 1 : 3 | Hit | +₹3,000 |
| 2 | 150 | 148 | 156 | 1 : 3 | Stop | −₹2,000 |
| … | … | … | … | … | … | … |
| 60 | 340 | 338 | 346 | 1 : 3 | Hit | +₹4,000 |
- Win-Rate: 27 winners, 33 losers → 45%
- Average Risk: ₹2,000
- Average Reward: ₹6,000
- Monthly P/L: (27 × 6k) − (33 × 2k) = ₹162,000 − ₹66,000 = ₹96,000 (96%)
- Realistic Adjustment: Slippage, commissions → ~48%.
Risk Management & Discipline
- Strict Stop-Loss Adherence: Never move or widen stops post-entry.
- Profit-Taking Discipline: Exit at target or use trailing stops to protect gains.
- Review & Adapt: Log every trade; adjust strategy if expectancy falls below 0.5 units.
- Avoid Overtrading: Stick to high-probability setups only.
Real-World Intraday Example on Silver (XAG/USD)
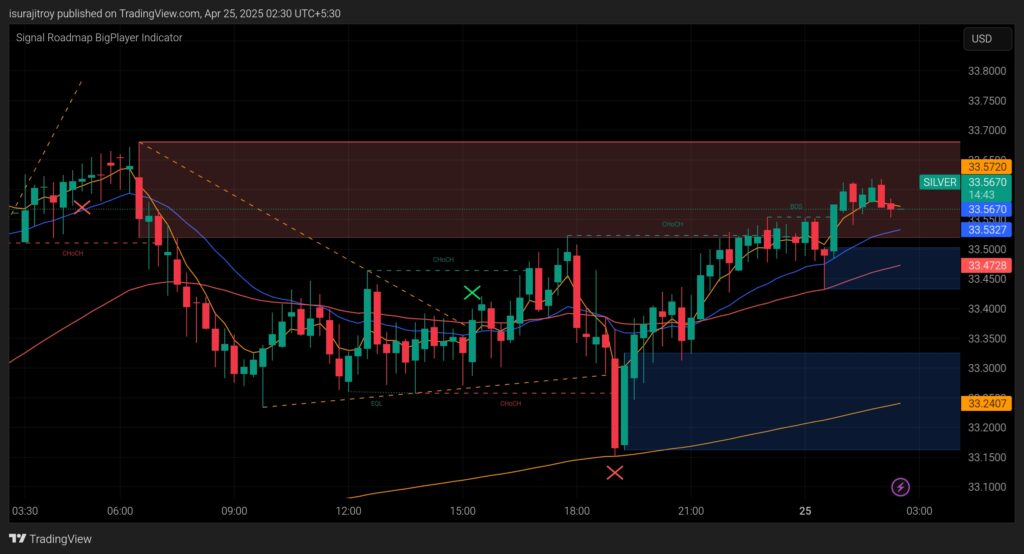
Let’s walk through four hypothetical 15-minute trades on April 24–25, 2025, using ₹100,000 capital and risking 1% (~₹1,000) per trade with a 1:3 R:R:
| Trade # | Entry | Stop-Loss | Target | R:R | Outcome | P/L |
| 1 | $33.5327 | $33.5027 | $33.6227 | 1:3 | Hit Target | +₹3,000 |
| 2 | $33.5670 | $33.5370 | $33.6570 | 1:3 | Stop-Loss | –₹1,000 |
| 3 | $33.5500 | $33.5200 | $33.6400 | 1:3 | Hit Target | +₹3,000 |
| 4 | $33.6000 | $33.5700 | $33.6900 | 1:3 | Stop-Loss | –₹1,000 |
- Total P/L: (+₹3,000 −₹1,000 +₹3,000 −₹1,000) = +₹4,000
- End-of-day Return: +4% on capital
Even with two losing trades, the 1:3 risk-to-reward ensures a net profit, illustrating how positive expectancy compounds over multiple setups.
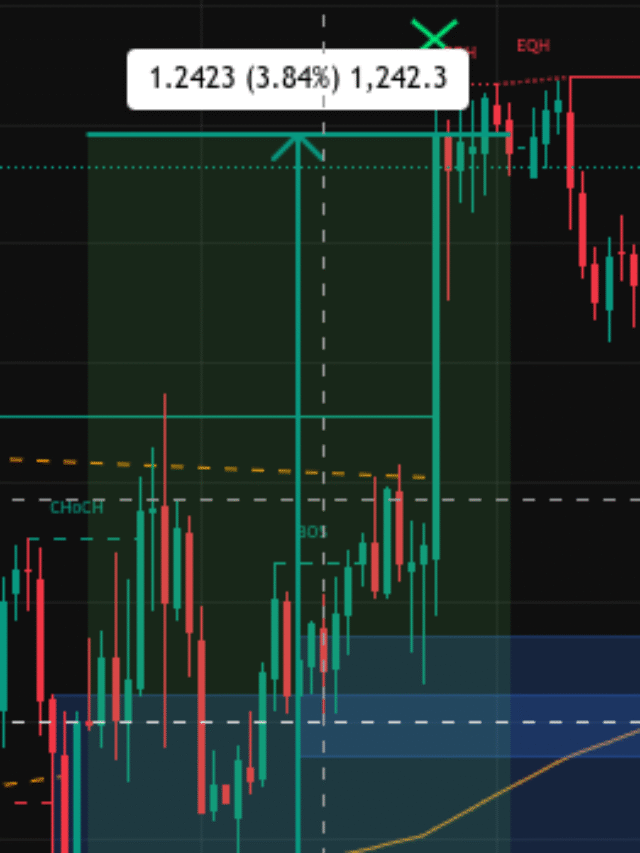
The Crucial Role of the “Signal Roadmap BigPlayer Indicator”
- Structure & Orderflow Clarity: The indicator automatically plots swing highs/lows, break of structure (BoS), and changes of character (ChoCH), so you can instantly see when the market shifts from bearish to bullish (and vice versa).
- High-Probability Zones: Colored supply/demand blocks highlight where “big players” have stepped in historically. These zones serve as logical entries (for buys near demand) and exits (for sells near supply), aligning your stops and targets with institutional activity.
- Visual Confirmation: Trendlines and equal-low/equal-high patterns remove guesswork: when price breaks a drawn trendline in the direction of the higher-timeframe trend, the indicator flags a new BoS, prompting you to plan a trade.
- Trade Management: As price approaches your target block, the indicator’s dynamically updated zones help you trail stops just outside the next minor structure level—locking in profits while giving the trade room to breathe.

Final Takeaway
By systematically applying a 1:3 risk-to-reward ratio, maintaining a 40–50% win-rate, and risking only 1% per trade, intraday traders can build a positive expectancy that, over 50–100 trades monthly, translates into consistent, compounding profits—targeting 5–8% net monthly returns while keeping drawdowns under control.