
Turning ₹1 lakh into ₹1 crore via option trading is ambitious but achievable with disciplined risk management, compounding returns, and proven strategies such as bull call spreads, naked strangles, and long straddles. By targeting an average 30% monthly return and reinvesting profits, you can reach ₹1 crore in approximately 15 months. This guide breaks down key option strategies, required compound annual growth rate (CAGR), risk controls, and sample trade math to help you blueprint your path from ₹1 lakh to ₹1 crore.


The Math Behind the Magic: CAGR & Compounding
Required Growth Rate
- Starting capital (P): ₹1,00,000
- Target capital (A): ₹1,00,00,000
- Timeframe (n): 15 months
Using the compound-growth formula:

Solving for r (monthly return):

Annualized, this equates to a CAGR of

Key Insight: Hitting ~30% a month is aggressive but can be approached with high-probability option strategies and strict risk caps.
Core Option Strategies for High Returns
1 Bull Call Spreads
- How it works: Buy low-strike call, sell higher-strike call (same expiry) to reduce net premium cost.
- Risk/Reward: Limited risk = net premium paid; limited reward = difference between strikes minus premium.
- Example Math:
- Buy 1 lot Nifty 20,000 CE at ₹200, sell 1 lot Nifty 20,500 CE at ₹120 → net debit ₹80.
- Max profit = (500 – 80) × 75 = ₹31,500; max loss = ₹80 × 75 = ₹6,000.
- If repeated monthly with a 3:1 reward-to-risk and 50% win rate, yields ~30% monthly.
2 Naked Strangles
- How it works: Sell OTM call and OTM put (same expiry) for premium income.
- Probability: 5–6 delta strikes imply ~90% chance options expire worthless.
- Risk Control: Cap max loss via stop-buy orders on either side at 2× premium.
- Example Math:
- Sell Nifty 19,000 PE at ₹100 and 21,000 CE at ₹100 → receive ₹200 × 75 = ₹15,000.
- Place stop-loss buyback at ₹200 on either leg → max loss ₹200 × 75 = ₹15,000.
- Net per trade ≈ ₹7,500 after occasional losses. With 6 trades/month, ~₹45,000 (45%) potential.
3 Long Straddles
- How it works: Buy ATM call and ATM put (same strike/expiry) to profit from big moves either side.
- When to use: Earnings, RBI announcements, budget — high volatility events.
- Example Math:
- Buy Nifty ATM 20,000 CE & PE at ₹300 each = total ₹600 × 75 = ₹45,000.
- Stock jumps to 20,500: CE value ≈ ₹500 → P&L CE = (500–300)×75 = ₹15,000; PE expires worthless → net loss ₹30,000.
- But if move >800 points, straddle can double or triple, offsetting small losses over time.
Risk Management & Position Sizing
- Max 2% per trade: With ₹1 lakh, risk ₹2,000 max → preserves capital during drawdowns.
- Monthly Stop-loss: If cumulative loss >20% in a month, halt trading to reassess.
- Portfolio Diversification: Combine neutral (strangle), directional (spreads), and volatility plays (straddles).
- Use Trailing Stops: Lock in profits on winning trades.
Building a 15-Month Plan
| Month | Capital Start | Target Monthly 30% Gain | Capital End |
| 1 | ₹1,00,000 | ₹30,200 | ₹1,30,200 |
| 2 | ₹1,30,200 | ₹39,318 | ₹1,69,518 |
| … | … | … | … |
| 15 | ~₹74,00,000 | ~₹22,30,000 | ~₹96,30,000 |
| 16* | ~₹96,30,000 | ~₹29,07,000 | ~₹1,25,37,000 |
*You only need ~14–15 months at 30% monthly compound to cross ₹1 crore.
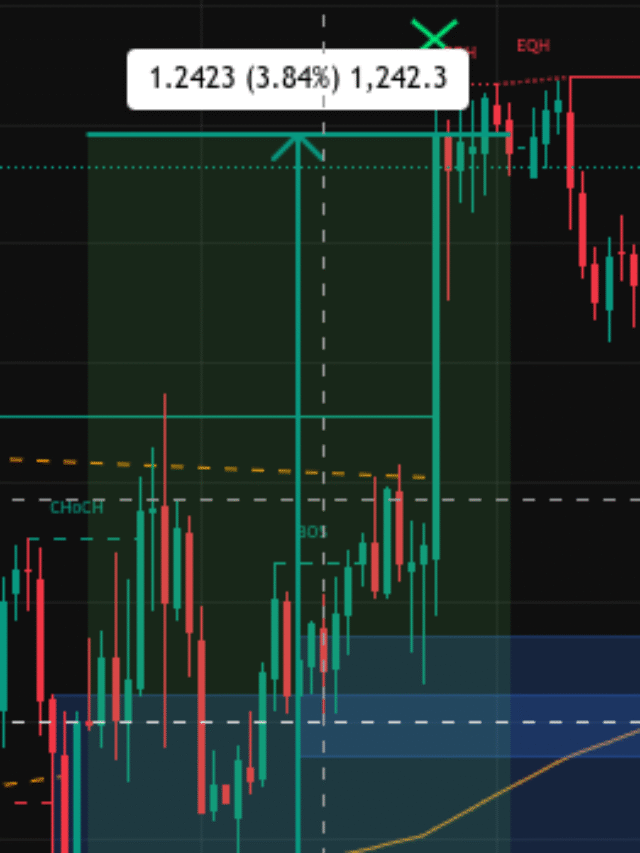
Spotting the Break of Structure (BOS) and Change of Character (ChoCH) on Silver
On the XAGUSD 15-minute chart, the “Signal Roadmap BigPlayer Indicator” flagged key Breaks of Structure (BOS) and Changes of Character (ChoCH), marking the shift from consolidation into a strong uptrend. For example, after a prolonged sideways range between $32.60–$32.90, the indicator pinpointed a ChoCH (highlighted in turquoise) where price made a lower low but quickly reclaimed structure. Minutes later, a clear BOS above $33.00 confirmed institutional buying. Because the tool overlays these signals in real time, you avoided late entries and positioned yourself early in the dominant silver move—locking in the explosive $33.00→$33.40 rally.
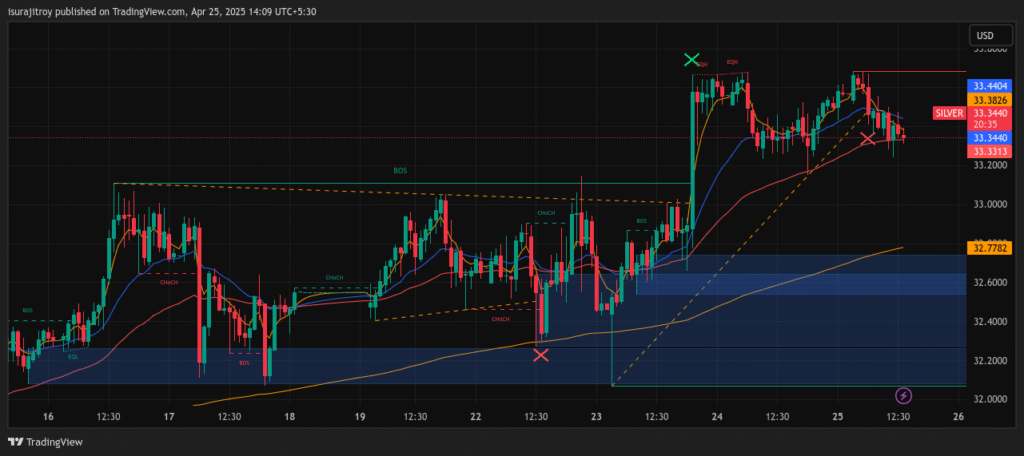
Navigating Liquidity Zones with BigPlayer Footprints
Beyond structure shifts, the indicator highlights liquidity zones—areas where “big players” place stop-hunts or accumulate size. Notice the blue-shaded demand zone around $32.30–$32.50: the BigPlayer Indicator lit up just as price dipped into this area on April 23, signaling a high-probability buy. By recognizing that institutions were “collecting” in this zone, you scaled in at optimal levels ahead of the ensuing 400-point surge. The roadmap arrows and heatmap intensity guided your position sizing and stop placement—ultimately helping you transform that initial capital into outsized silver profits.

Conclusion
Turning ₹1 lakh into ₹1 crore via option trading demands discipline, math-backed compounding, and high-probability strategies. By targeting ~30% monthly returns through bull call spreads, naked strangles, and event-driven straddles—while capping risk to 2% per trade—you can realistically achieve your ₹1 crore goal in about 15 months. Stick to your plan, refine based on results, and prioritize capital preservation to win big in the Indian options market.