
In technical analysis, triangle patterns are often utilized by traders to predict potential breakout points and continuation trends. For a bullish trending market, these patterns provide invaluable insights for identifying entry points in an upward movement. In this blog post, we’ll take an in-depth look at three common triangle patterns—the ascending triangle, the symmetrical triangle, and the falling wedge—and explore how they can be used effectively in a bullish market. We’ll also incorporate some mathematical calculations for precision.


1. Ascending Triangle Pattern
What is the Ascending Triangle?
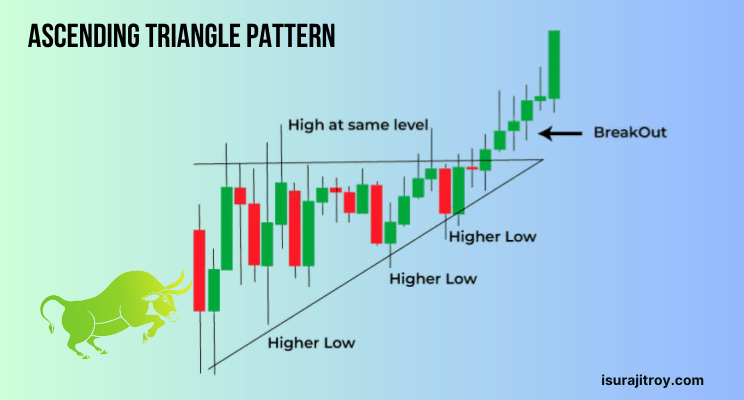
The ascending triangle is a continuation pattern, typically formed during an uptrend. It is characterized by a horizontal resistance line at the top and a rising support line at the bottom. Traders view this pattern as an indication that the market is likely to break out upward.
- Resistance line: Horizontal, formed at the peak price levels.
- Support line: Upward-sloping, formed at increasing lows.
How to Trade the Ascending Triangle
The ascending triangle suggests that buyers are getting more aggressive, driving prices higher. However, sellers are trying to defend the resistance level, causing the price to test this level multiple times before breaking through.
- Breakout Point: The pattern is completed when the price breaks above the resistance level.
- Target Calculation: The breakout target is calculated by measuring the height of the triangle (the vertical distance from the resistance to the support line) and adding this distance to the breakout point.
Mathematical Calculation Example:
Let’s assume the following:
- Resistance line (top) is at $150.
- The support line (bottom) starts at $130.
- The vertical height of the triangle is $150 – $130 = $20.
Breakout Target Calculation:
- The breakout point is reached when the price crosses above $150. Adding the height of the triangle ($20) to this resistance level gives us a target of $170.
Summary:
- The ascending triangle signals that an upward breakout is likely, with a target price determined by the height of the triangle.
- Ideal entry: As soon as the price crosses the resistance line at $150.
- Stop-loss: Below the support line, at around $130.
2. Symmetrical Triangle Pattern
What is the Symmetrical Triangle?
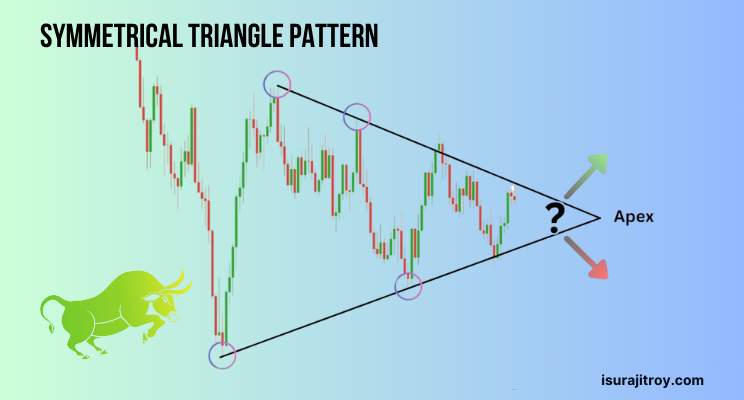
A symmetrical triangle forms when the market consolidates between two converging trendlines: one descending and one ascending. These trendlines squeeze the price action into a tighter range, indicating that market participants are uncertain. Eventually, a breakout occurs, and in the context of a bullish trend, the breakout typically happens to the upside.
- Resistance line: Descending, drawn at the highs.
- Support line: Ascending, drawn at the lows.
How to Trade the Symmetrical Triangle
- Breakout Point: A breakout to the upside occurs when the price breaks above the descending resistance line.
- Target Calculation: Like the ascending triangle, the height of the symmetrical triangle is measured, and that distance is added to the breakout point.
Mathematical Calculation Example:
Assume:
- The upper resistance line is at $160.
- The lower support line is at $140.
- The height of the triangle is $160 – $140 = $20.
Breakout Target Calculation:
- The breakout point is when the price crosses above $160. Adding the height of $20 gives a target of $180.
Summary:
- The symmetrical triangle signals that the price will eventually break out, with the upside breakout being ideal in a bullish trend.
- Ideal entry: After the breakout above $160.
- Stop-loss: Below the support line, around $140.
3. Falling Wedge Pattern
What is the Falling Wedge?
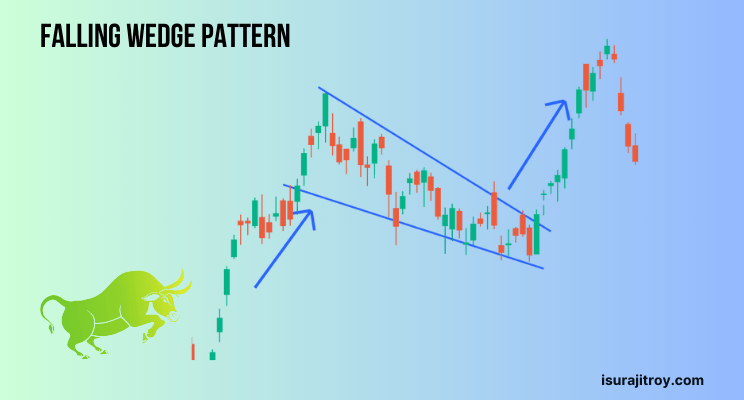
The falling wedge is a reversal pattern that typically forms during a downtrend. In a bullish market context, it indicates a potential reversal from a bearish trend to a bullish trend. The pattern is characterized by converging trendlines, both descending but with the support line descending at a slower pace than the resistance line.
- Resistance line: Descending, but at a steeper slope.
- Support line: Descending, but at a shallower slope.
How to Trade the Falling Wedge
The falling wedge pattern indicates that the selling pressure is slowing down, and buyers may soon take control. A breakout to the upside signals that the bullish trend is resuming.
- Breakout Point: The price breaks out when it crosses above the resistance line.
- Target Calculation: The target is calculated by measuring the vertical distance between the initial support and resistance lines and projecting it upward from the breakout point.
Mathematical Calculation Example:
Consider:
- The resistance line is at $110.
- The support line is at $90.
- The height of the wedge is $110 – $90 = $20.
Breakout Target Calculation:
- The breakout occurs above $110. Adding the height of $20 gives a target of $130.
Summary:
- The falling wedge indicates a reversal to the upside, making it a great pattern for spotting bullish trends after a period of consolidation.
- Ideal entry: Once the price breaks above the resistance level of $110.
- Stop-loss: Below the support line, near $90.
Final Thoughts on Triangle Patterns for Bullish Trends
Triangle patterns, whether ascending triangles, symmetrical triangles, or falling wedges, provide traders with significant opportunities in a bullish market. They all share the common characteristic of consolidation followed by a breakout, with the expectation that the price will continue its upward trend after the breakout.
To effectively trade these patterns:
- Always measure the height of the triangle to calculate the potential breakout target.
- Enter the market once the price confirms the breakout.
- Set your stop-loss orders just below the support line to minimize risk.
By incorporating these triangle patterns into your technical analysis strategy, you can make more informed decisions and increase your chances of success in bullish trending markets.