
Geopolitical and Economic Context
Recent geopolitical and economic shocks have strongly favored precious metals. For example, rising Middle East conflicts (e.g. renewed Israel–Gaza hostilities) and new U.S.–China tariff threats have “injected a new bid into gold,” helping push it past $3,000/oz. Concurrently, fears of a global slowdown (trade-driven recession risks) and political uncertainty in the U.S. (debates over Fed policy under the Trump administration) have dented confidence in the dollar. Reuters notes that amid this uncertainty the dollar “slipped against its rivals to hold near a three-year low,” making gold more attractive. In sum, safe-haven demand has driven gold and silver sharply higher in early 2025, while the USD Index (DXY) traded in a sideways range near recent lows.


Technical Analysis: Gold
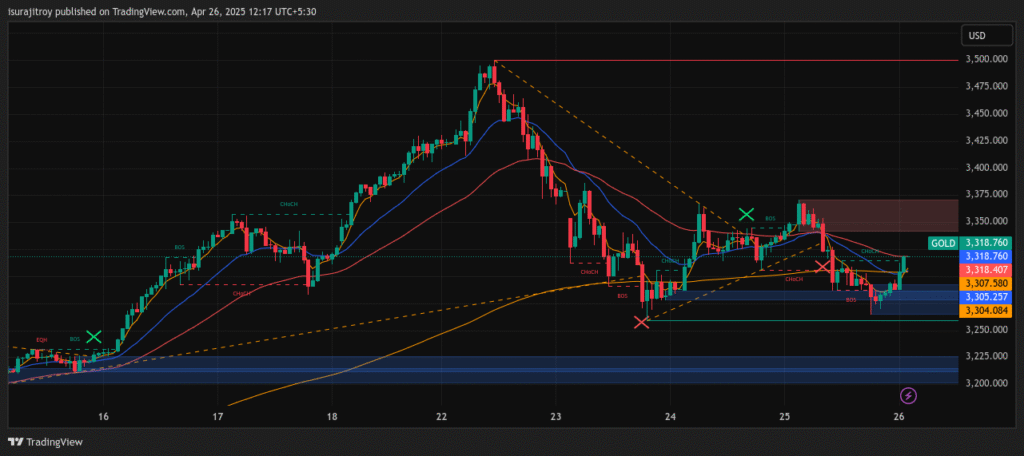
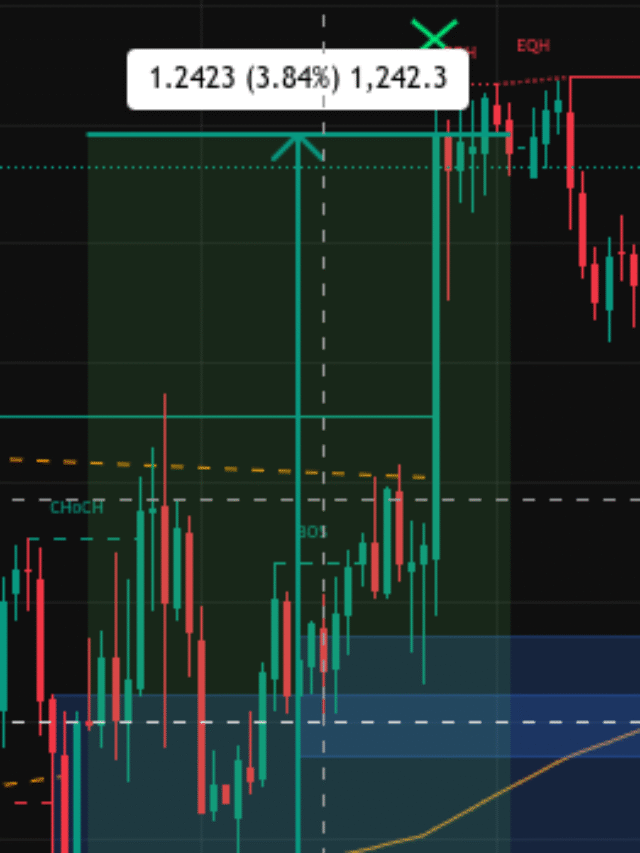
The Gold price chart (1-hr bars) shows a recent bullish swing. Price has bounced from a strong demand zone near $3,250 and cleared the prior swing high (a bullish Break of Structure, or BOS). It now trades above the 20- and 50-period moving averages, signaling renewed upward momentum. FX analysts note that “gold remains heavily supported by a broadly weaker dollar, uncertainty … and fears about a global recession”, consistent with this chart’s breakout. Fibonacci extensions from the last low ($3,250) give initial upside targets around $3,400–3,500 (and 100% extension ~$3,750). Above $3,375–3,400 (the recent supply zone), psychological barriers at $3,400–3,500 come into play. Key support lies back at the $3,250 demand area and then $3,200 (near the 200-period MA). In short, gold’s structure is bullish (BOS on the upside) but traders should monitor pullback levels for entries or stops.
Technical Analysis: Silver
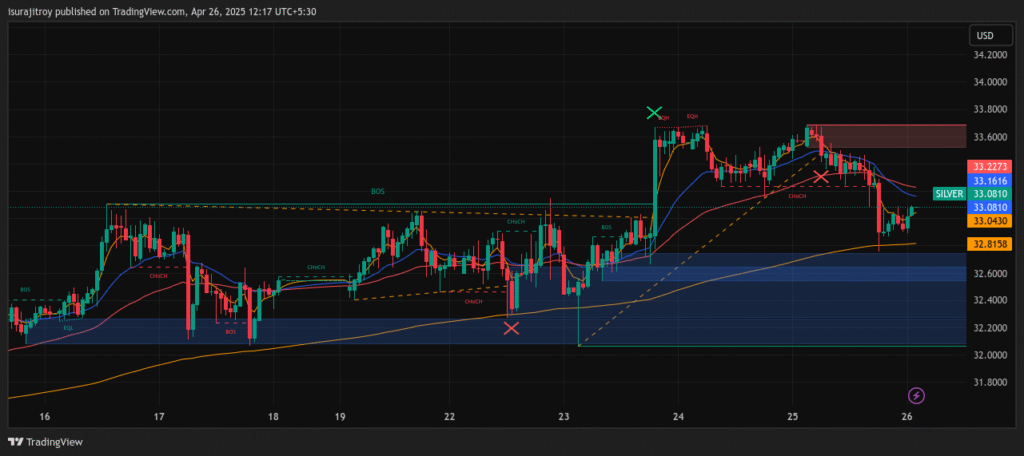
The Silver price chart shows a narrower range. Silver has formed support around the $32.6–32.8 demand zone and resistance near $33.6. A breakout above ~33.1–33.2 (its recent swing high) would be a bullish BOS, confirming upside momentum. According to technical forecasts, near-term support is ~$32.34 and resistance ~$33.12 – a tight corridor that suggests a breakout is imminent. Indeed, silver has risen ~15% YTD, reaching ~$33.4 (a peak not seen since late 2024). Analysts point out that silver is now “poised to challenge a 10-year peak near $35”, implying targets in the $34–35+ range if it clears current supply. On the downside, breaking below ~$32.4 would threaten a deeper drop towards the $32.0 demand base. Overall, silver’s chart is turning bullish, and commentators expect it to “play catch-up” to gold’s rally after lagging behind.
Technical Analysis: U.S. Dollar (DXY)
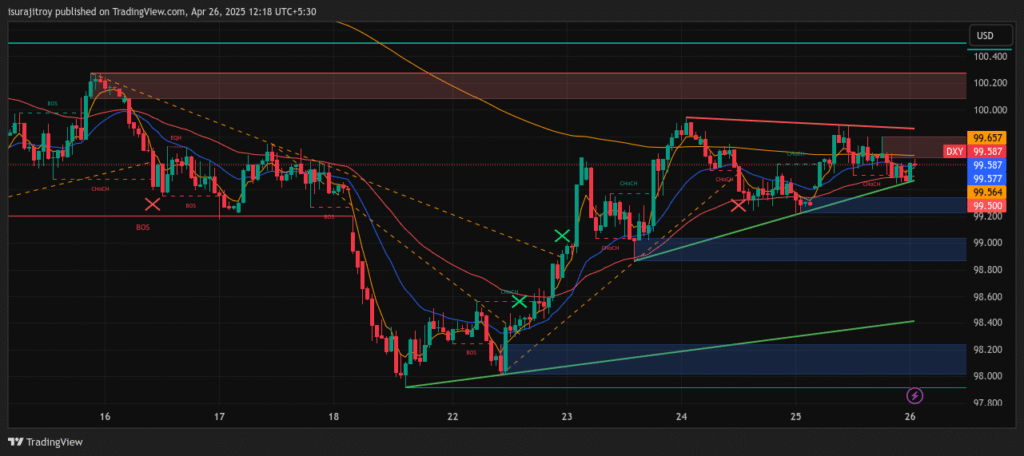
The US Dollar Index chart reveals a tightening range. Price has been bounded by resistance around 100.0–100.3 (red supply zone) and an ascending support line near 99.2. The pattern resembles a small triangle. A break above ~100.3 (BOS to the upside) could send DXY toward 101.0–102.0, whereas a drop below ~99.0 would shift bias bearish (a Change of Character, or CHOCH), potentially testing the mid-98s. In line with the recent chart, Reuters noted the dollar “tumbled to its lowest level in three years” as political and economic confidence faded. The dollar can also swing sharply on news: for example, a 90-day tariff pause announced by President Trump in early April caused the USD to rebound strongly against safe-havens. Thus, the technical outlook is neutral until a clear break: DXY is likely to trade roughly between ~98.5 and 100.3 in the near term, with bulls needing a clean BOS above 100.3 to push higher, and bears eyeing a breakdown below ~99.0 as a signal of weakness.
Price Projections (6-Month Targets)
| Asset | Bullish Targets | Bearish/Support Levels |
| Gold | ~$3,400–3,500 (psychological zone; fib-extension near $3,750) | ~$3,150–3,200 (strong demand area; 200-period MA) |
| Silver | ~$34.0–35.5 (near 10-year highs) | ~$32.0 (base of demand zone) |
| USD/DXY | ~$100.5–101.0 on breakout (then ~$102+) | ~$98.0 (break below ~99.0); extended target ~$96–97 if momentum shifts |
These projections combine the technical levels above with Fibonacci and volatility reasoning. For example, drawing a fib-extension from Gold’s recent $3,250 low to its $3,500 high yields ~ $3,750 at 1.0×, suggesting further upside if bull momentum continues. On the other hand, a failure to hold Gold above $3,300 could target the prior support near $3,150. Silver’s range-breakout (33.4 high to $35+) is similarly framed by its 2024–25 swing extremes. For DXY, maintaining above the rising support line (~99) could test 100.5–101, whereas a decisive break lower may drive a quick drop to ~97 in line with its longer-term uptrend line.
Moderate-Risk Investment Strategy (3–6 Month Horizon)
- Allocation: Maintain a diversified, USD-based portfolio. Consider ~30–40% in Gold, ~10–15% in Silver, and 45–60% in USD cash/bonds. (Gold’s larger allocation reflects its stronger safe-haven status; silver is more volatile.)
- Entry (Gold): Add on dips toward strong support (e.g. buy near $3,250). This aligns with “buy the dip” strategies since analysts note gold corrections have been unusually shallow in 2025. Stop-loss: ~2–3% below the entry level or below the $3,200 demand zone. Targets: Scale out around $3,400–3,450 first (near resistance), then $3,500–3,550.
- Entry (Silver): Initiate positions near $32.5 (just above its demand zone). Stop-loss: ~$31.50 (below the zone). Targets: $34.0, $35.0 (with an eye on $35.5 if momentum is strong). Silver often lags gold, so acceleration towards those highs is expected once gold sustains its rally.
- USD Positioning: Keep core holdings in USD to remain liquid and hedge. Consider a small contrarian USD position if risk-on news emerges (e.g. buy dips around 98.0 with stops just below the ascending trendline) – this offers optionality if the dollar snaps back. More generally, plan for 98–100 range: add to gold/silver on dips and raise USD exposure if metals stall.
- Risk Management: Use proper stops beyond structure points. For example, placing a stop just below the $3,200 support (Gold) or $31.50 (Silver) would limit drawdowns. Follow a max-loss rule (e.g. 1–2% capital per trade). Given the persistent bid under gold (per Saxo Bank, “rallies have been unhinged” but pullbacks shallow, a trailing stop strategy on gains may be effective.
- Rebalancing & Timeframe: Over 3–6 months, adjust positions as technical signals dictate. If gold convincingly tops $3,400, trim some longs into $3,500. Conversely, if dollar strengthens (e.g. CPI surprises or Fed hawkish), lock in profit and hold cash. Continue monitoring supply/demand zones and moving averages for major BOS/CHOCH signals.
Table: Projected Price Ranges (3–6 months)
| Asset | Bullish Scenario (6M) | Bearish Scenario (6M) |
| Gold | $3,400–3,500 (extension to ~$3,750) | $3,100–3,200 (if breakdown of $3,250) |
| Silver | $34.0–35.5 (challenge 10-year highs) | $31.5–32.0 (support area) |
| DXY | 100.5–101.0+ (break above 100.3) | 97.5–98.5 (below current range) |
Each figure above is derived from recent chart pivots and Fibonacci extensions. They should be updated as news evolves. This balanced strategy – partial gold/silver exposure with USD liquidity – aims to capture upside if safe-havens rally further, while limiting losses if risk sentiment abruptly reverses. Investors should always adapt to new data, but current indicators favor further strength in gold and silver against a mostly range-bound dollar.