The European Union manages international trade through its Single Market for member states and external commercial policies. It balances protectionism for some industries with the need for global trade due to dependencies on goods and technology from non-EU countries, like the US and China, despite potential conflicts and security concerns. Retaining trade with China while addressing security issues is a key challenge in the 2020s.
Who do EU countries trade with the most?
Germany is both the largest exporter and the top export market within the EU. In recent years, the country’s trade surplus, often criticized by other EU nations, has rebalanced. Germany’s share of total EU imports dropped from 15% to under 12% in 2022, while its share of all exports from EU countries increased from under 13% to nearly 14%. The United States and major EU economies like France, Belgium, Italy, and the Netherlands are also significant export destinations, whereas the UK’s relative share of EU exports has halved since 2002.
Annual goods trade balance of the European Union from 2002 to 2022.
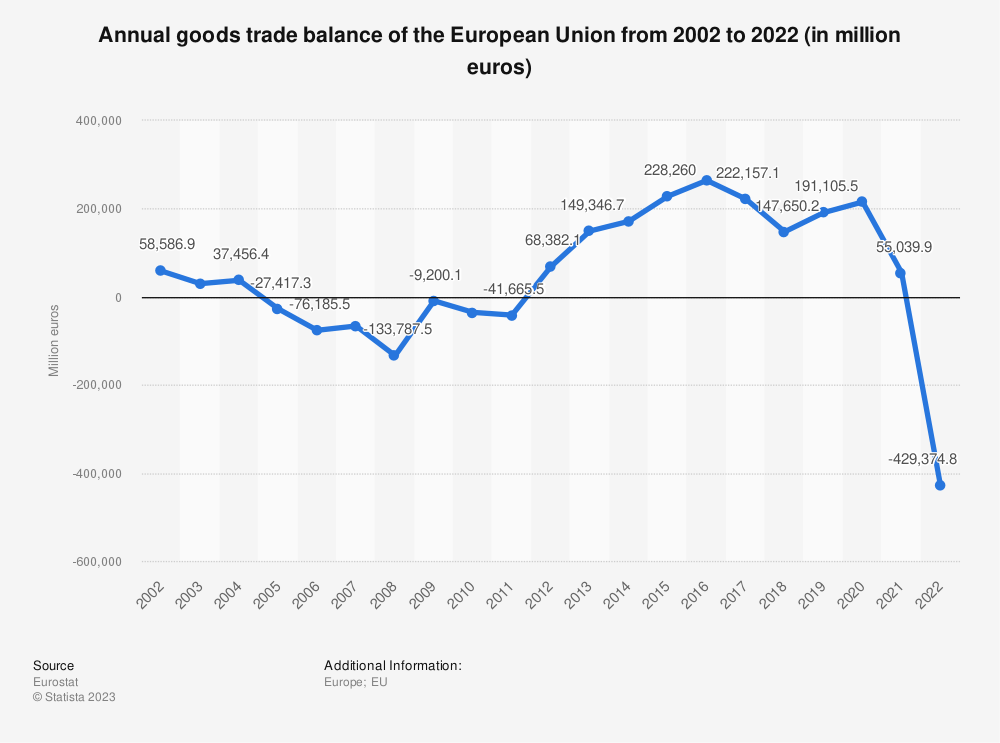
The European Union shifted from a trade surplus to a significant deficit of nearly 430 billion euros in 2022. This sudden deficit was driven by a sharp increase in fuel import costs due to Russia’s invasion of Ukraine and the EU’s boycott of Russian energy exports. Accounting irregularities often lead to the EU running a surplus with itself despite balancing its external trade.
Balance of trade in services in the European Union in 2021, by member state.
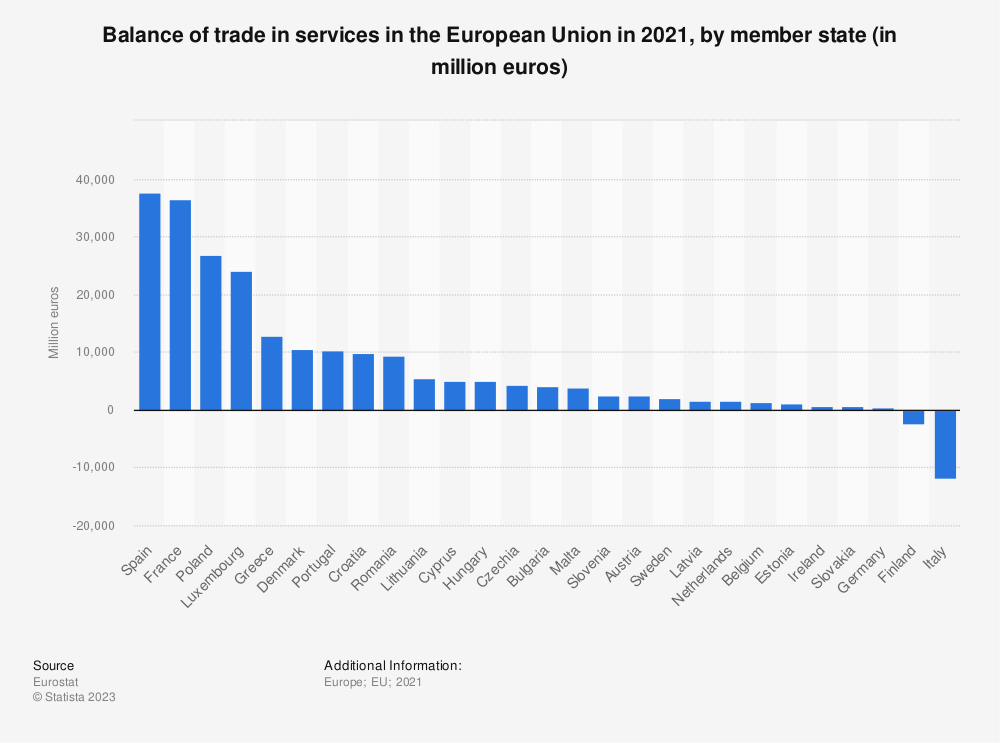
In 2022, Spain, France, and Poland had the largest service trade surpluses within the EU. Italy and Finland were the only countries with deficits, with Italy’s deficit at nearly 12 billion Euros, exceeding Finland’s 2.3 billion Euros.
Share of intra- and extra-EU exports in total 2002-2022
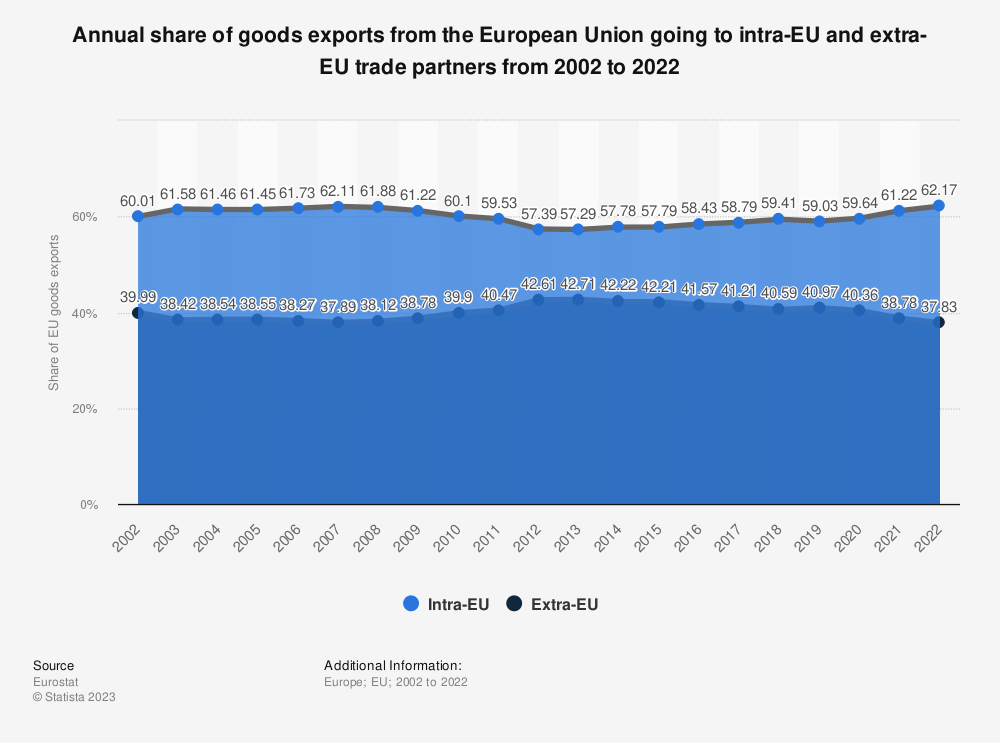
The share of EU member states’ exports to other EU countries declined during financial crises but rebounded to around 62% in the early 2020s. The UK’s exit in 2020 didn’t significantly impact the share, highlighting the declining importance of the UK as an EU trade partner.
Share of intra- and extra-EU imports in total 2002-2022
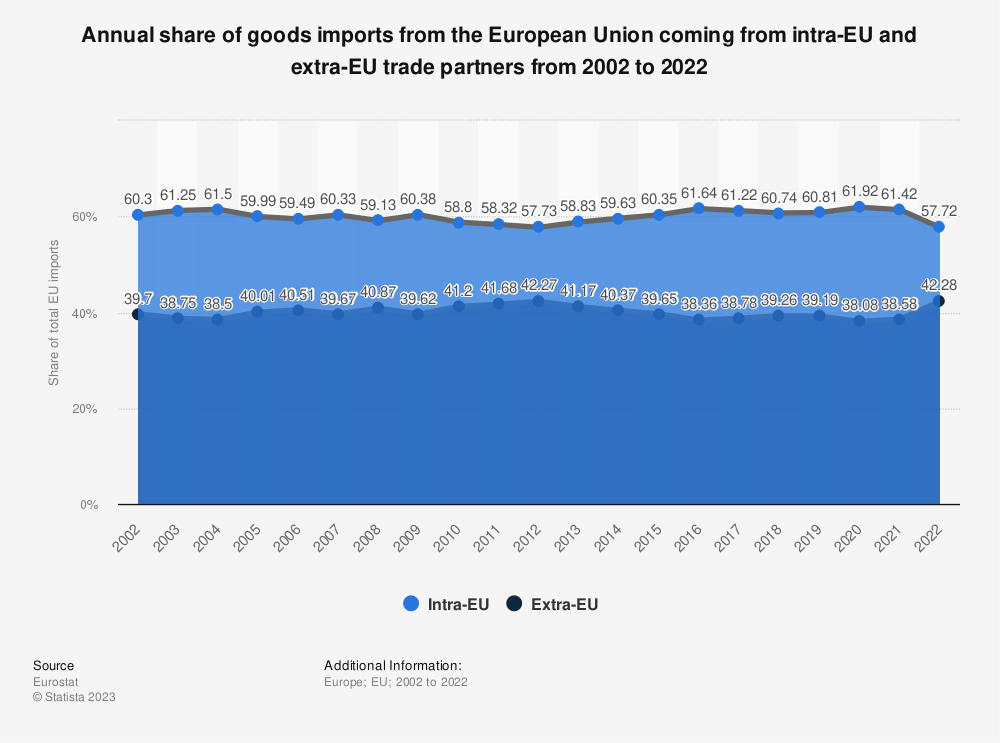
The share of EU imports from intra-EU trade decreased from 62% during the COVID-19 pandemic in 2020 to 57.72% in 2022. Imports from outside the EU reached a 20-year high, partly due to China’s emergence as a global export power and the UK’s exit from the EU in 2020, which shifted imports from intra-EU to extra-EU trade.
EU share of world exports and imports 2002-2021.
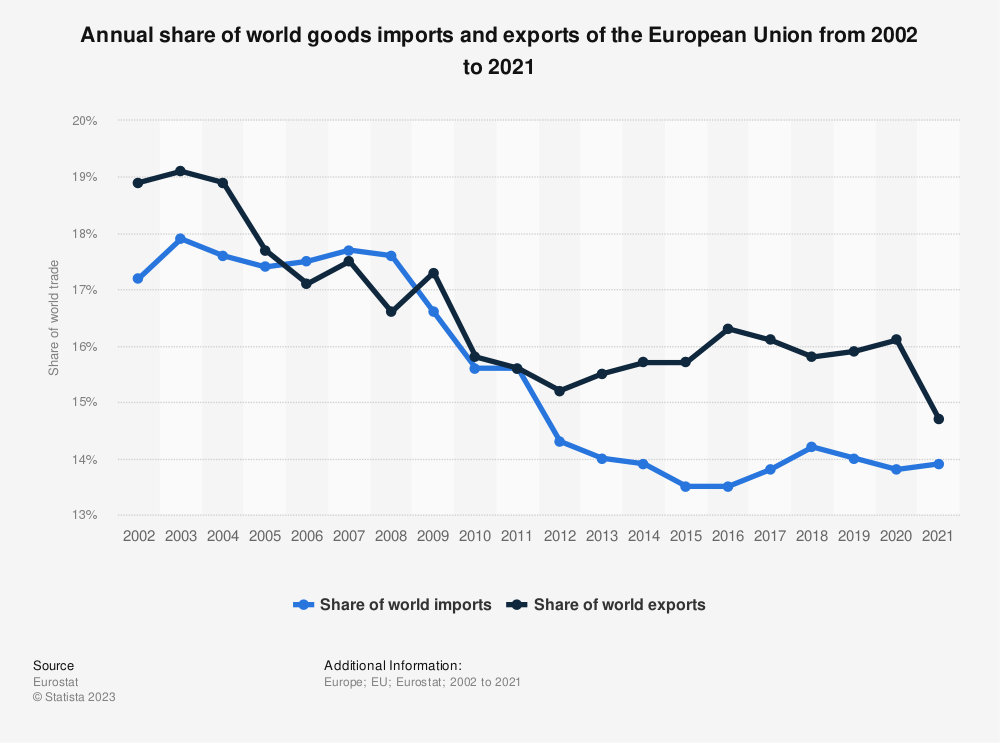
Over the past two decades, the European Union’s share of world exports and imports has decreased. The EU initially ran a small trade deficit during the Great Recession and Eurozone crisis, followed by a substantial surplus post-2011, driven by countries like Germany specializing in exports of chemicals, manufactured goods, and heavy machinery. This was supported by limited real wage growth for EU workers, while the EU also imported heavy manufactured goods and served as a notable energy and fuel importer.
External trade balance of the EU by product 2002-2021.
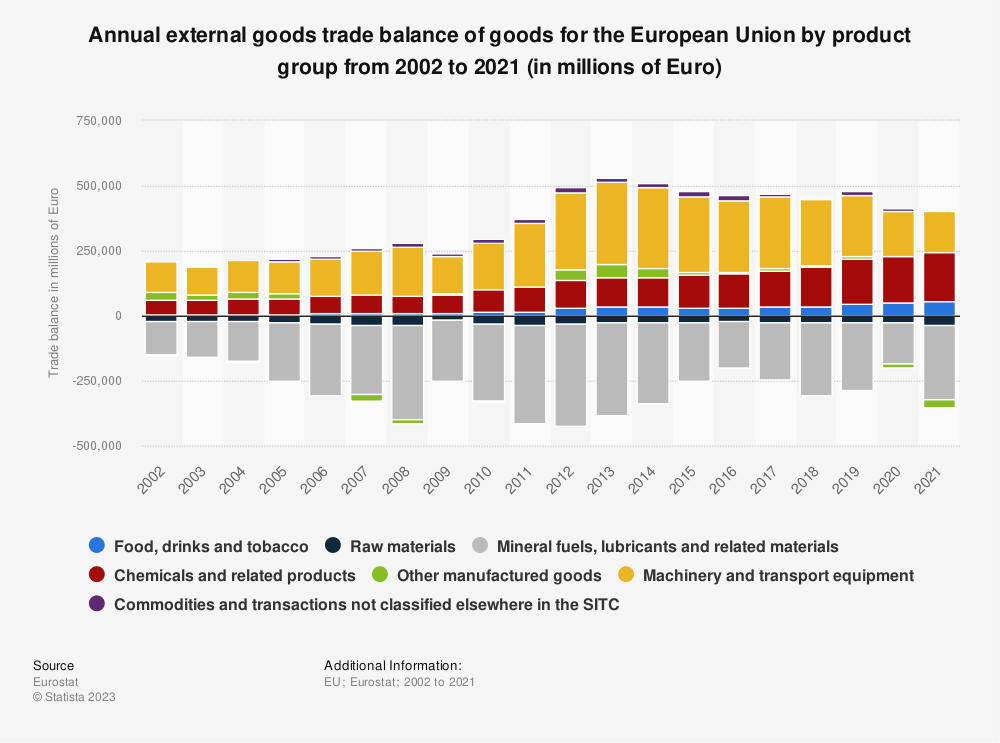
The EU must export more manufactured goods than it imports to cover its energy deficit. Over two decades, it increased surpluses in machinery, transport equipment, and chemicals while facing a fuel deficit that peaked in the early 2010s before declining. The EU’s future trade surplus is uncertain due to the energy crisis following the 2022 Russian invasion of Ukraine. The EU aims to reduce fossil fuel dependence and become a clean energy superpower, potentially transitioning from energy deficit to exporter.
Emerging trade partners.
China and Poland have seen their shares of EU exports more than double, but they still account for under 4% each. China’s share of EU imports tripled, making it the third-largest EU exporter. It overtook the US as the largest external exporter in 2005, now representing 8.7% of EU imports compared to the US’s 5%. Russia’s share of EU imports doubled from 2002 to 2012 due to raw materials and energy dependence. However, EU sanctions post-Crimea annexation and the Ukraine invasion in 2022 caused a decline, with further decreases expected as the EU reduces ties with Russia.
EU Trade Policy in the 21st century.
The European Union is a member of major international trade organizations like the WTO, IMF, and World Bank. It has been active in forming trade agreements with partners worldwide, including candidate countries and countries in East and South-East Asia. The EU-UK Trade and Cooperation Agreement was signed in 2020, maintaining preferential trade post-Brexit, but the UK’s share of EU trade has decreased. The EU’s ambitious Transatlantic Trade and Investment Partnership (TTIP) with the US was shelved when President Trump opposed it in 2016, amid concerns about standards and investor-state dispute settlement provisions eroding democratic control.
Conclusion
In conclusion, the European Union’s trade landscape is dynamic and complex. It balances intra-EU trade with external trade, while facing challenges like shifting partnerships, energy concerns, and geopolitical conflicts. As the EU navigates this ever-changing terrain, its ability to adapt and maintain its position in the global economy will be a key determinant of its future success.
Source: Statista