

The International Monetary Fund’s World Economic Outlook Database, October 2023 projected India’s GDP at 5.944 trillion U.S. dollars in 2028, which puts the 5 trillion dollar mark inside its forecast period. The same data showed real GDP growth of 6.33% and inflation of 5.46% for 2023, national debt at 83.75% of GDP in 2021, and a general government budget deficit forecast at 7.23% of GDP in 2028. The sections below take each indicator in turn. All figures are the October 2023 estimates and forecasts; later IMF releases will differ.
Gross domestic product (GDP) in India 2028
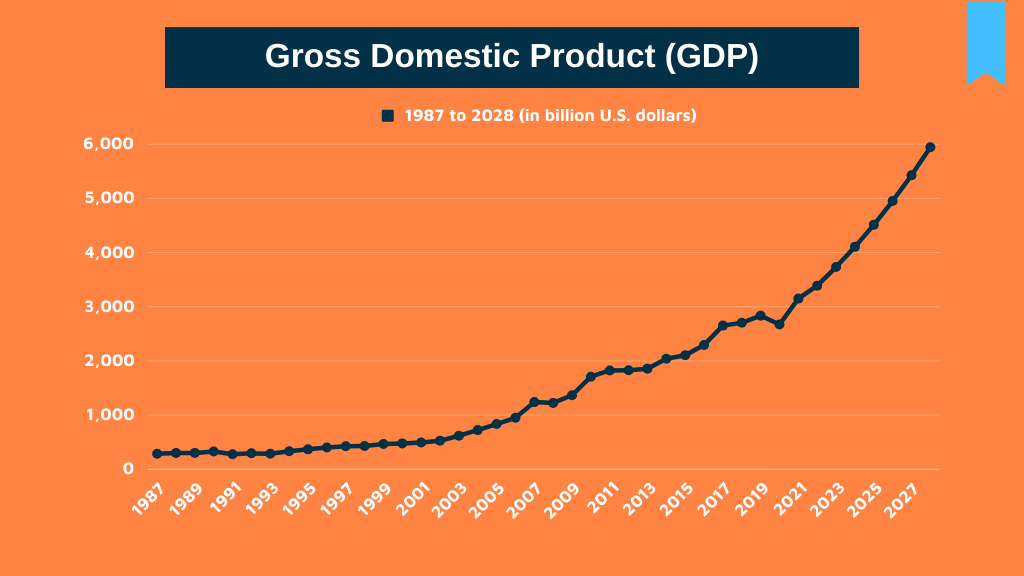
The chart covers India’s GDP from 1987 to 2028. In 2019, GDP was 2.84 trillion U.S. dollars, and the forecast rises to 5.944 trillion U.S. dollars in 2028. Much of that growth depends on trade; the products India sells abroad are analysed in India’s top export and import commodities by HS code.
Inflation rate
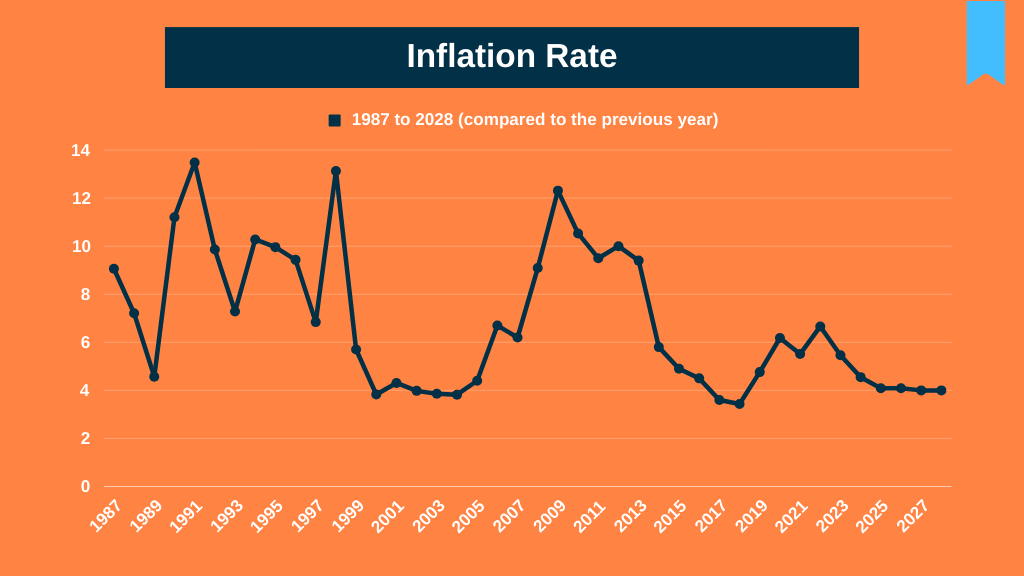
Inflation in India has moved up and down over the years. For 2023 the October 2023 estimate was 5.46%. The chart shows the rate from 1987 to 2028, which tracks changes in consumer prices across goods and services.
GDP per capita
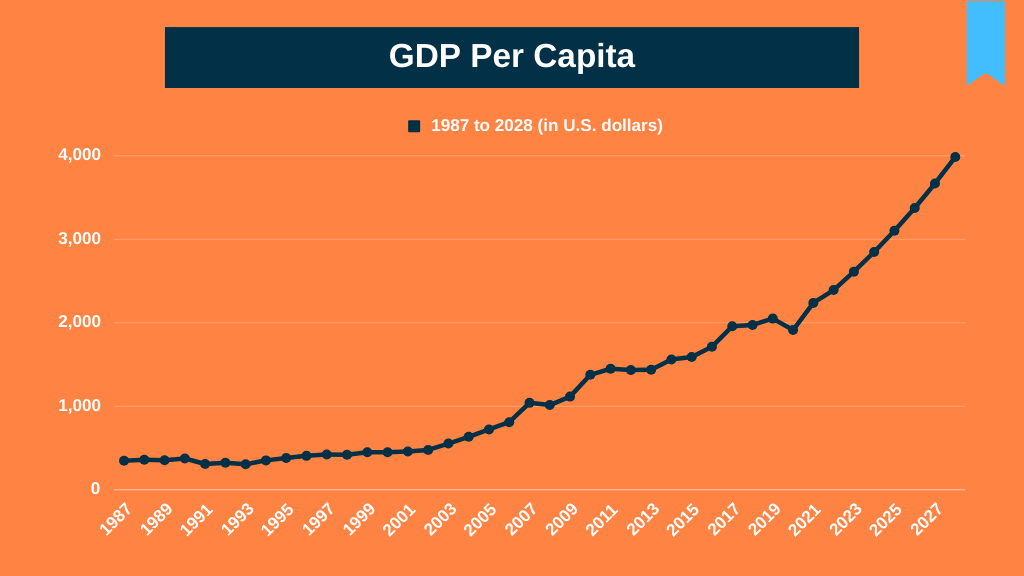
The chart shows India’s GDP per capita from 1987 to 2028. In 2020, estimated GDP per capita was $1,913.22. For comparison, China’s GDP per capita had already reached $6,995.25 in 2013.
Real GDP growth
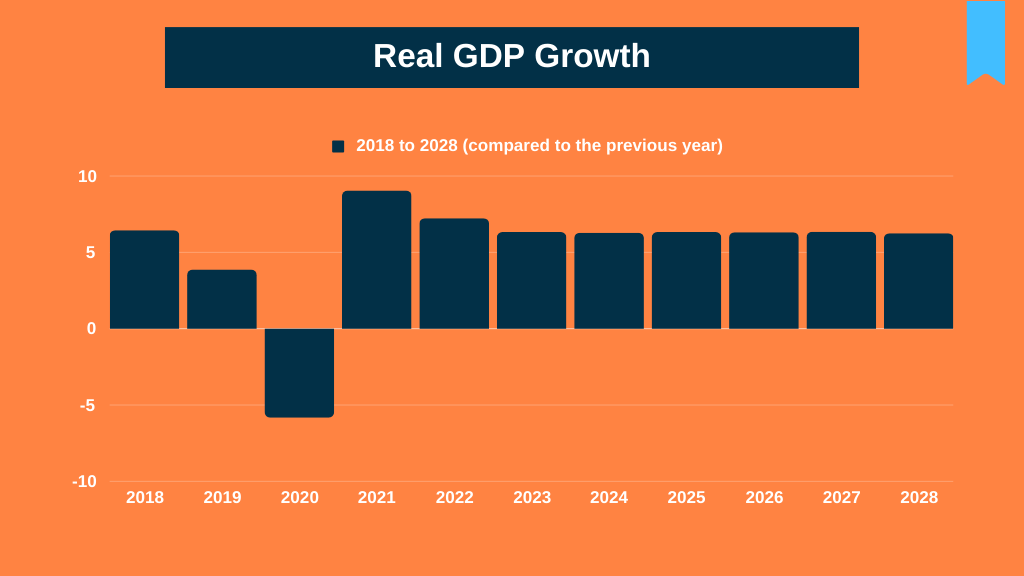
Real GDP growth, which adjusts for price changes, is shown from 2018 to 2028. For 2023, the October 2023 data put India’s real GDP growth at 6.33%, and the projections show growth staying positive throughout the period.
National debt
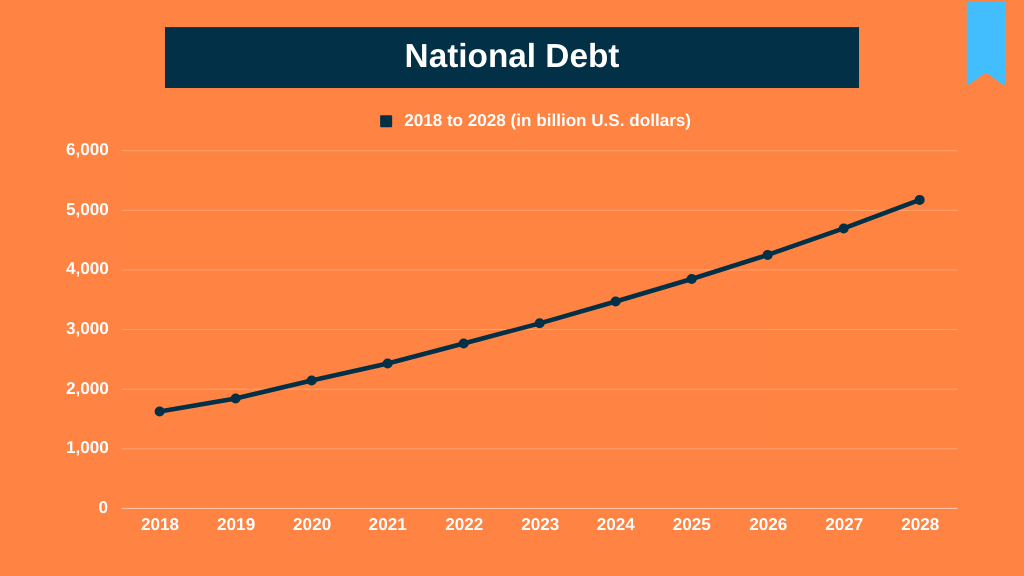
India’s national debt reached 2.43 trillion U.S. dollars in 2021. The figures rise every year in the series, from 1,626.17 billion U.S. dollars in 2018 to an estimated 5,174.80 billion U.S. dollars in 2028.
National debt in relation to GDP
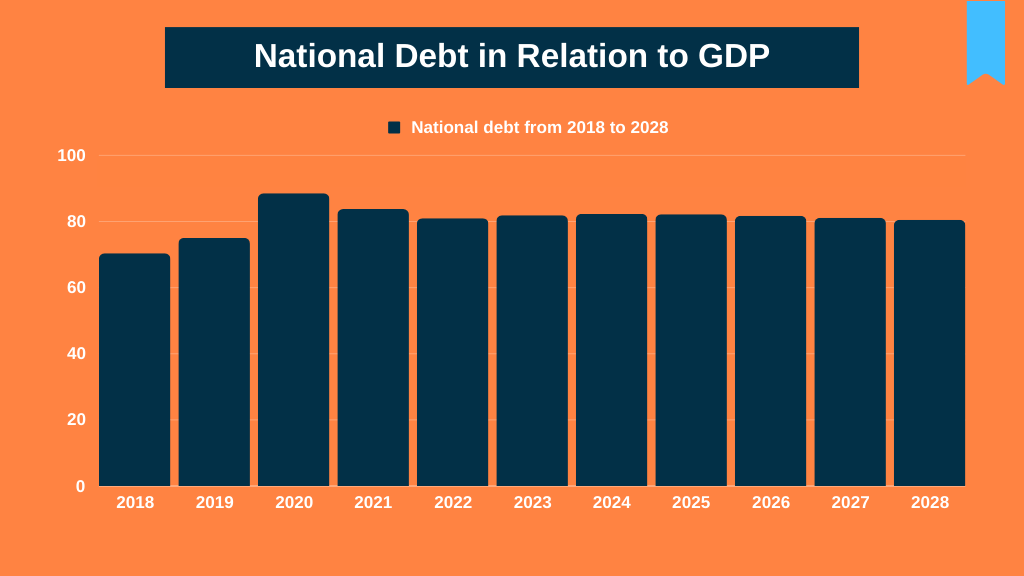
Measured against GDP, India’s national debt fluctuated between 2018 and 2021 and reached 83.75% in 2021. The projections to 2028 put the debt-to-GDP ratio at around 80.50%. Debt is growing in dollar terms, but the economy is projected to grow at a similar pace, so the ratio stays roughly level.
Budget balance
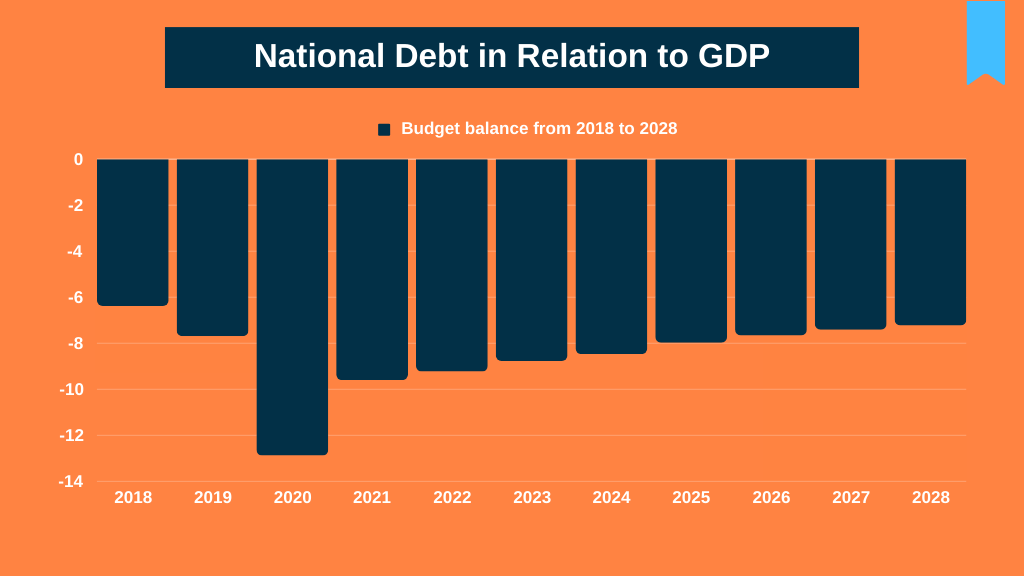
The budget balance measures general government net lending or borrowing: revenue minus total expenditure, as a share of GDP. Between 2023 and 2028 it was projected to improve by a total of 1.5 percentage points. On this forecast, 2028 would be the eighth consecutive year of improvement, with the balance reaching -7.23 percent of GDP.
Reading these numbers
Taken together, the October 2023 figures describe an economy projected to pass 5 trillion dollars by 2028, growing at over 6% in 2023, with public debt above 80% of GDP and a large budget deficit. For what this means for foreign businesses, see why investors look at India, and for the export side, India’s $2 trillion export target and the role of HSN classification.