Disclaimer: The ETFs (stocks) discussed in this article are not investment recommendations. I am not a SEBI-registered investment advisor. The securities market is subject to market-driven risks, and investments can fluctuate in value. Please seek advice from a registered financial advisor before making any investment decisions. This analysis is for informational purposes only and should not be considered as financial or investment advice.
Exchange-Traded Funds (ETFs) have become an essential part of investment portfolios, providing diverse exposure to various sectors and indices. This article presents a detailed analysis of the performance of five ETFs over the past year, covering key metrics such as trade volumes, price movements, and volatility.
ETFs Analyzed
- CPSEETF
- ALPHA
- MOMOMENTUM
- ALPL30IETF
- MOMENTUM
Portfolio Composition
The portfolio composition of each ETF is crucial in understanding their performance. The ETFs are designed to track specific market indices or sectors, which can impact their returns.
- CPSEETF: CPSEETF tracks the NIFTY CPSE Index, which is composed of 20 stocks from the Central Public Sector Enterprises (CPSEs) sector. The ETF’s portfolio is diversified across various sectors, including energy, finance, and infrastructure.
- ALPHA: ALPHA tracks the NIFTY Alpha 50 Index, which is composed of the top 50 stocks from the NIFTY 50 Index based on their market capitalization. The ETF’s portfolio is diversified across various sectors, including technology, finance, and consumer goods.
- MOMOMENTUM: MOMOMENTUM tracks the NIFTY Momentum 50 Index, which is composed of the top 50 stocks from the NIFTY 50 Index based on their momentum. The ETF’s portfolio is diversified across various sectors, including technology, finance, and consumer goods.
- MOMENTUM: MOMOMENTUM tracks the NIFTY Momentum 50 Index, which is composed of the top 50 stocks from the NIFTY 50 Index based on their momentum. The ETF’s portfolio is diversified across various sectors, including technology, finance, and consumer goods.
- ALPL30IETF: ALPL30IETF tracks the NIFTY ALPL 30 Index, which is composed of the top 30 stocks from the NIFTY 50 Index based on their liquidity. The ETF’s portfolio is diversified across various sectors, including technology, finance, and consumer goods.
Trade Volume Analysis
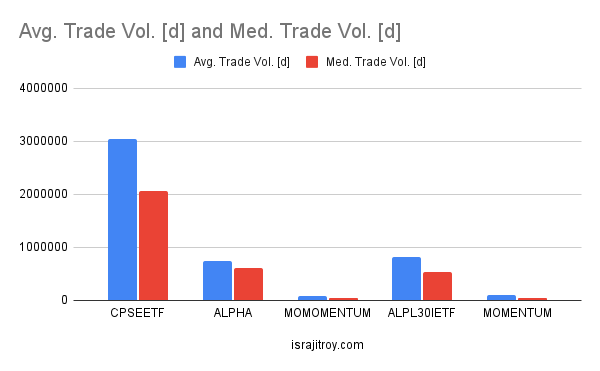
CPSEETF stands out with the highest average daily trade volume of 3,042,010 and a median of 2,058,134. This indicates strong investor interest and high liquidity, making it an attractive option for traders looking for high-volume securities. In contrast, MOMENTUM exhibits the lowest average (100,656) and median (42,466.5) trade volumes, suggesting lower liquidity and possibly higher volatility due to fewer trades.
Price Movement Analysis
Open vs. Day High
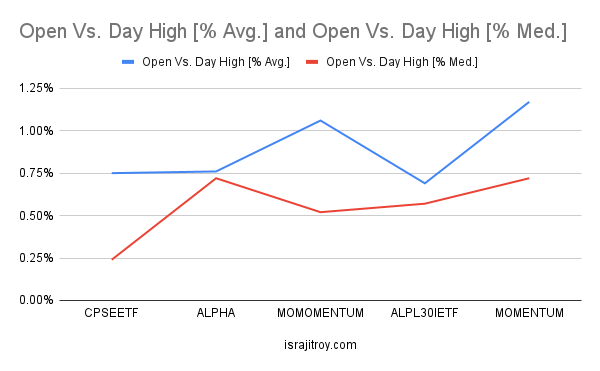
- MOMENTUM shows the highest average (1.17%) and median (0.72%) increases from open to day high, suggesting significant intraday upward potential.
- ALPL30IETF displays the lowest average (0.69%) and median (0.57%) increases, indicating more stable intraday performance with less drastic price movements.
Previous Day Close vs. Next Day High
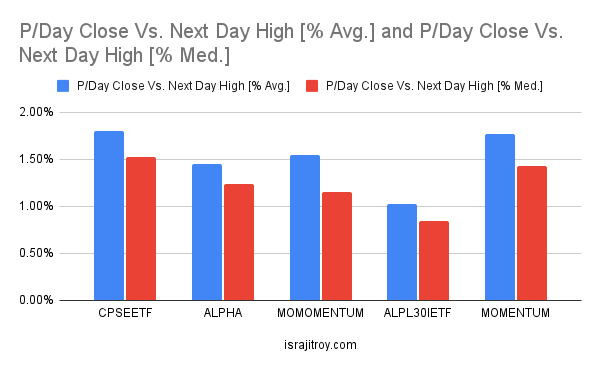
- CPSEETF and MOMENTUM exhibit notable next-day potential gains with averages of 1.80% and 1.77%, respectively, making them appealing for short-term traders looking for quick gains.
- ALPL30IETF again shows the least potential for next-day gains with an average of 1.02%, reflecting its conservative nature.
Volatility Analysis
Previous Day Low vs. Next Day High
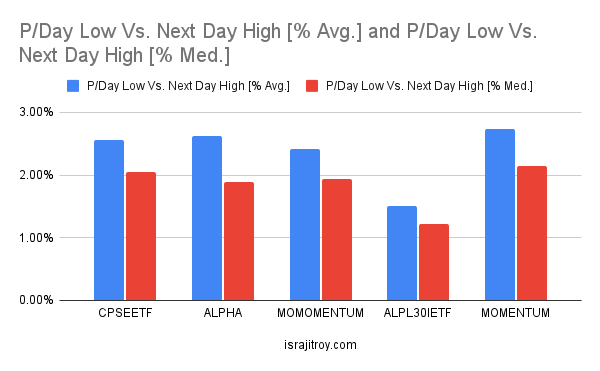
- MOMENTUM leads with the highest average (2.74%) and median (2.15%) increases from the previous day’s low to the next day’s high, indicating high volatility and potential for significant gains.
- ALPL30IETF shows the lowest average (1.50%) and median (1.22%), confirming its status as the least volatile ETF among the five.
Day Low vs. Day High
- CPSEETF and MOMENTUM are the most volatile intraday with averages of -2.82% and -2.88%, respectively. This high volatility can be leveraged for intraday trading strategies.
- ALPL30IETF exhibits the least intraday volatility with an average of -1.65%, making it a safer bet for risk-averse investors.
Day Low vs. Open
The percentage change from the day low to the open price shows relatively smaller differences among the ETFs. CPSEETF has the highest average change at -2.10% and median change at -1.72%, while ALPL30IETF remains the least affected with an average change of -0.97% and a median change of -0.64%.
Download The Full Report
Conclusion
CPSEETF emerges as the most actively traded and volatile ETF, offering high liquidity and substantial price movements. This makes it ideal for aggressive traders seeking high-volume and high-volatility instruments. On the other hand, MOMENTUM also presents significant volatility and price movement opportunities, although with lower trade volumes compared to CPSEETF.
ALPL30IETF appeals to conservative investors due to its stable performance and low volatility. ALPHA and MOMOMENTUM serve as middle ground options, offering moderate activity and volatility levels, suitable for balanced trading strategies.
Investors should consider these characteristics when selecting ETFs to match their risk tolerance, investment goals, and trading strategies. As always, it’s important to conduct thorough research and possibly consult with a financial advisor to tailor investments to individual needs.
Key Takeaways
- CPSEETF: High liquidity and volatility, suitable for aggressive traders.
- MOMENTUM: High volatility with lower liquidity, ideal for short-term trading.
- ALPL30IETF: Low volatility, stable, suitable for conservative investors.
- ALPHA and MOMOMENTUM: Moderate activity and volatility, fit for balanced strategies.
By understanding these nuances, investors can make informed decisions and better navigate the dynamic landscape of ETFs.
Thank you for visiting my blog! If you enjoyed this ETF analysis and want more insights, please tag me on X (Twitter) at x.com/isurajitroy Your engagement and feedback are greatly appreciated!